Getting started
Installation
Pre-compiled binaries can be found in Releases for following platforms:
- Windows x86-64
- Ubuntu x86-64
- MacOS x86-64
For platforms outside of the supported list, the build can be produced locally, see the corresponding guide.
In all cases, clang-build-compiler is a stand-alone executable with no additional dependencies.
For additional convenience it is advised to add clang-build-compiler to the PATH.
Usage
Basics
Compile your project using clang++ with -ftime-trace flag enabled. The compiler will place JSON traces together with the object files.
To analyze a specific trace (which corresponds to a single translation unit) and output results to the terminal run:
clang-build-profiler --file=<path_to_json_trace>
To analyze all traces in a directory run:
clang-build-profiler --target=<path_to_directory>
To analyze an entire CMake build run:
clang-build-profiler --build=<path_to_cmake_build>
Tip
When invoked with no arguments, clang-build-profiler assumes --build=build/ by default.
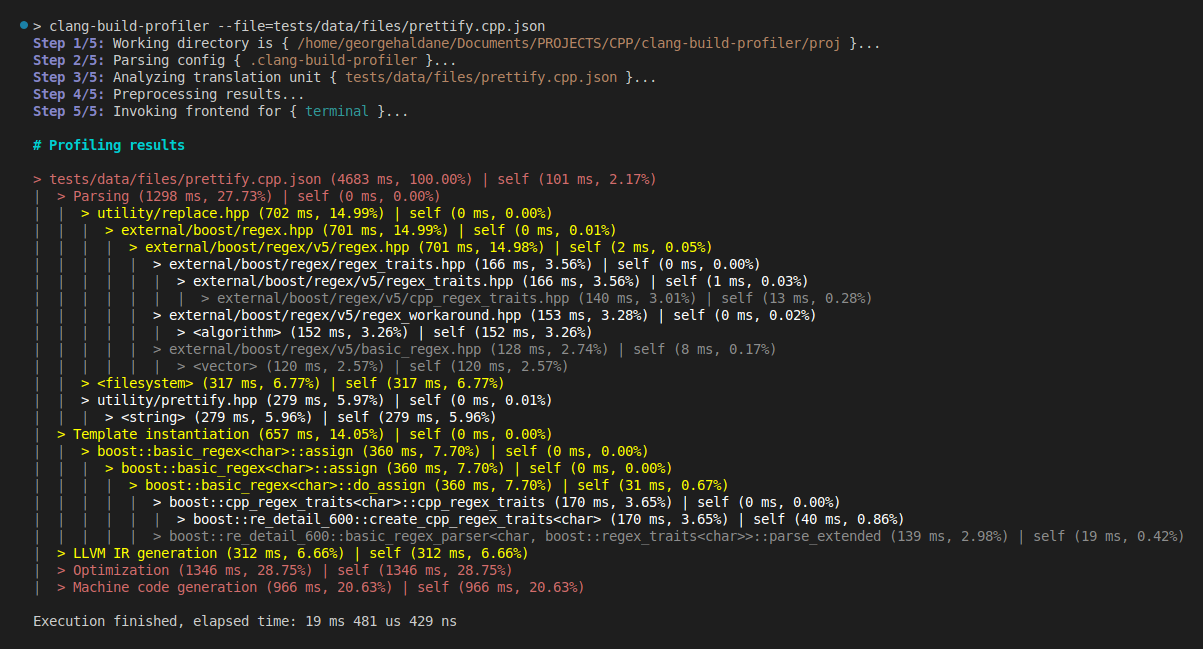
Output example:
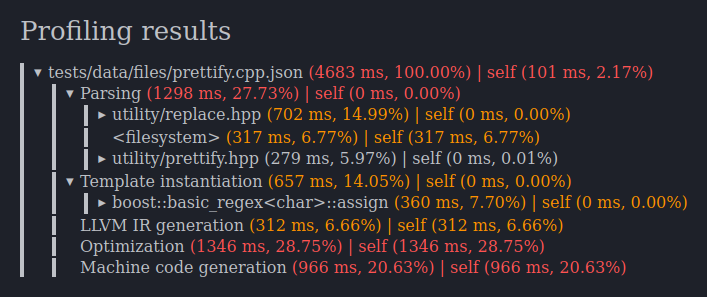
Using --output=html we can generate a stand-alone HTML report with collapsable sections:

Generated report can be opened in any browser:
Making the output pretty
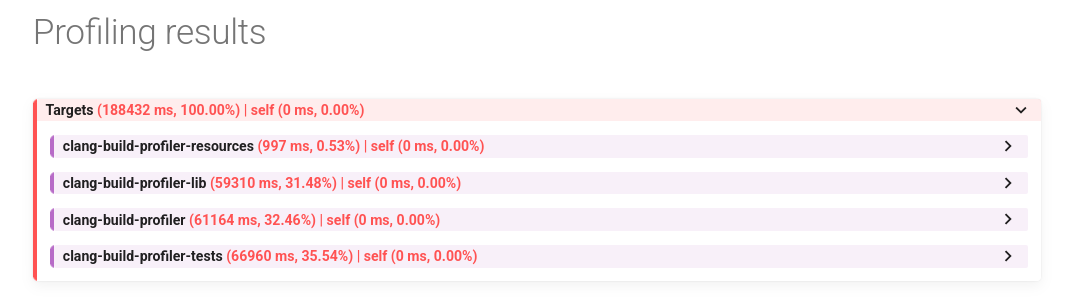
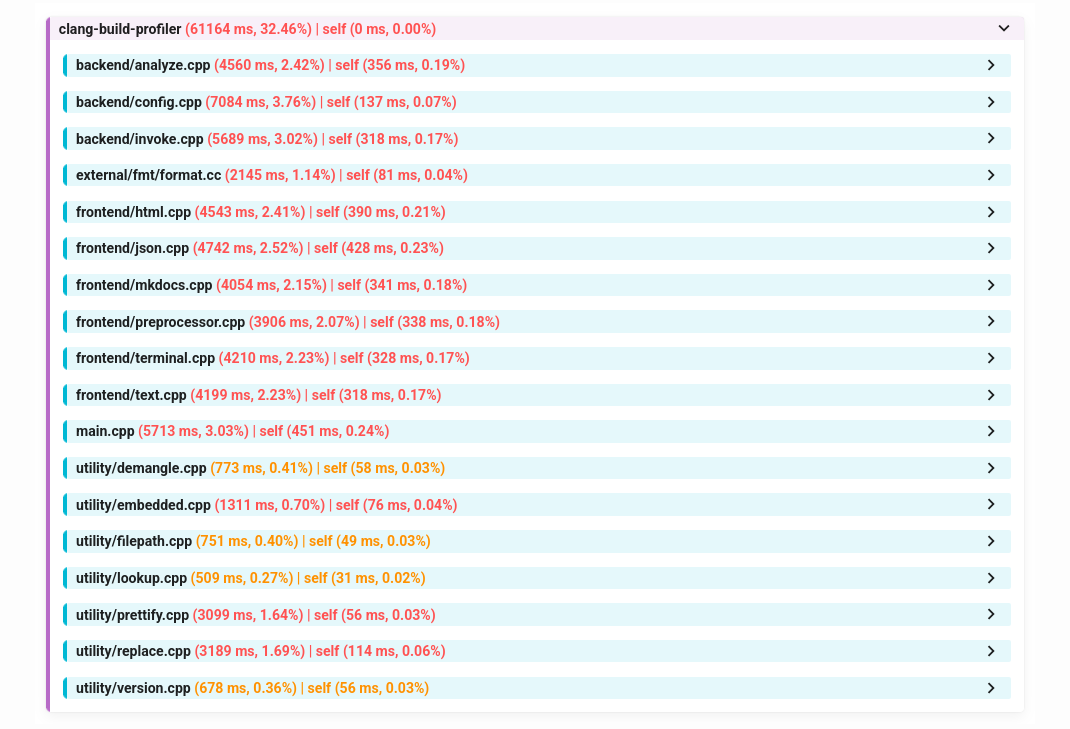
Using mkdocs we can generate even prettier reports with proper GUI.
mkdocs can be installed with pip:
pip install mkdocs-material
After this we can analyze the build:
clang-build-profiler --output=mkdocs
And visualize it in the browser using mkdocs:
(cd .cbp && mkdocs serve --open)
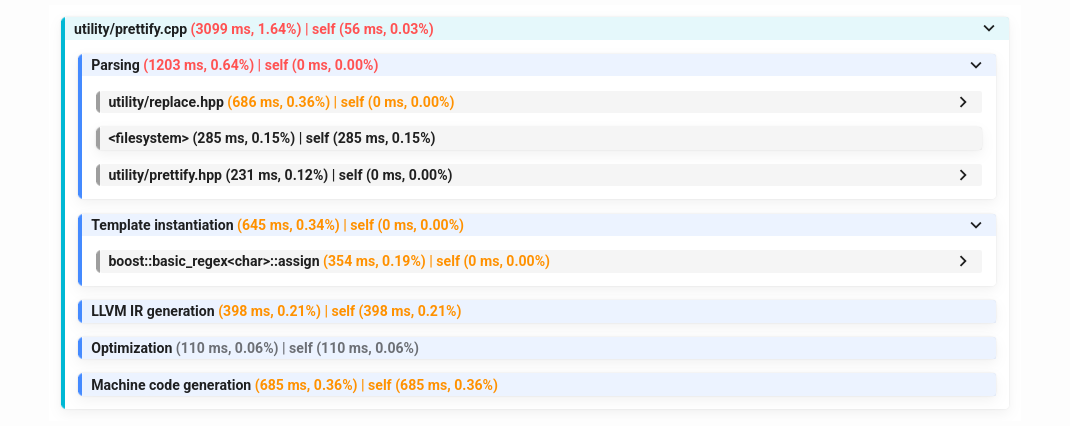
Output example:
Tip
pip together with python3 can be installed using apt or grabbed directly from the official website:
sudo apt update &&
sudo apt install python3
Configuration file
Following the convention of other LLVM tools, clang-build-profiler uses a YAML config .clang-build-profiler placed into the project root.
This config contains project-specific settings such as coloring, name simplification rules and etc.
For more details, see the corresponding guide